The Data Desk · Plate A
Ten questions about SBA lending, answered from the record.
I read 2.17 million federal loan records, reconciled the main totals to SBA’s own reports where possible, and revised the findings where the evidence did not hold. Start with the question you actually have.
data.sba.gov FOIA
Section AStart With Your Question
Each answer is one section of the flagship report-
Section 01 · The Cycle
Where are we in the cycle?
FY2025 posted a record dollar year: $37.29B across 78,078 loans. Thirty-two years of data say the program lurches, doubling in booms and halving in busts, and the loans written at the top carry scars that surface two to four years later.
Read the cycle → -
Section 02 · The Credit-Box Echo
Is 2007 happening again?
The share of loans flowing through lender books that doubled in two years has run above 20% for three straight fiscal years. In twenty-six years of data, the only other stretch like it is 2005-07, and that vintage became the worst in program history.
Read the echo → -
Section 03 · The Friction Economy
Why do approved deals die before closing?
16.6% of FY2025 approvals had not funded by the March 31, 2026 FOIA release, the highest rate in the file’s history back to FY1991, and the median time-to-close nearly doubled to 21 days. The record shows four suspects and convicts none of them.
Read the friction economy → -
Section 04 · The Distress Census
Which industries are hurting right now?
The March 2026 release is the first to show live distress for every active loan. Transportation sits worst at 10.86% of its active loans delinquent, past due, or in liquidation, more than triple the healthiest sector on the table.
Read the census → -
Section 05 · The Franchise Ledger
Does the brand on the door matter?
It is not supposed to be a credit variable. In the matured FY2010-19 book it is one of the largest: two brands in the same sector can sit five to seven times apart on charge-off, each measured with confidence intervals across 12,767 loans.
Read the ledger → -
Section 06 · Price & Selection
Is a high quoted rate a warning sign?
In matched cohorts, higher initial rates line up with higher charge-offs. Sort same-size, same-vintage borrowers by initial rate and charge-off climbs quartile by quartile with no reversals, ending near 4x between top and bottom across 56,000 loans. The open question is who the signal belongs to.
Read price & selection → -
Section 07 · The Hype Pipeline
Are car washes still a gold rush?
The startup-lending boom peaked in FY2021 and has declined every year since. Laundromat and vending are riding the same curve behind it, vending by roughly four years, and the FY2022 car-wash class is already 11.2% in trouble at roughly four years old.
Read the pipeline → -
Section 08 · The Lender Landscape
Does lender choice change the outcome?
Send the same borrower through 195 different SBA lenders and the charge-off odds vary by an order of magnitude. The gap survives adjustment for sector, size, and program mix. Skill looks like the leading explanation, and it is not the whole story.
Read the landscape → -
Section 09 · The July 4 Regime
What actually changed on July 4?
7(a) and 504 stop counting against each other, the first combined-ceiling change since 2010. The confirmed opening: 7(a)-heavy borrowers in building-ownership industries get full, fresh 504 capacity. The headline capacity numbers built on top of that are shakier, and the section shows the math.
Read the regime → -
Section 10 · The Road Ahead
What happens next?
Four calls, on the record, in the order they resolve, each written so a specific future data point can prove it wrong. That includes when the vending bill comes due (FY2028-29) and what the fast-grower echo does to the FY2024-25 book.
Read the road ahead →

Also on the desk
-
Interactive · The Loan Map
Where are approvals recorded?
1.9 million loans on one map. Lending intensity per 1,000 businesses so hot spots mean penetration, not population. Click any state and see it zip by zip, filtered by program and era.
Explore the map → -
Provenance · How to Read All of It
The method is part of the claim.
For the main figures, the report shows the source file, denominator, date, and method. Approval is not funding, a charge-off is not proof a business failed, and small samples are suppressed. The methodology appendix has the rest.
Read the methodology →
No. 001 · cut along the dotted line
Honest Capital
One straight finding from the loan record, every other Tuesday.
Free. Written by me, not a content team. Unsubscribe in one click.
Section BUse It Today
Every section closes with working guidance, gathered by seatEach section of the report ends with what to do about it. Here is all of it in one place, by the chair you sit in.
For Brokers
A record placement year proves appetite, not margin. Build your pitch on underwriting discipline inside the boom, not on the boom.
Treat a fast-doubling lender relationship as a diligence flag. Ask whether the growth is small-balance velocity, a new charter scaling, or loosened standards. They carry different risk.
Set borrower expectations at 21 days to close, and underwrite up front for the two late-stage deal killers: the $50,000 collateral trigger and the 10% equity injection on start-up and change-of-ownership deals.
Underwrite transportation deals on the assumption that borrower distress outlasts the freight cycle. Press for current fleet utilization and receivables aging.
The credit signal sits in the model under the brand: dues-based vs. prepaid, real-estate carry, unit economics. Two brands in the same sector can sit five to seven times apart.
A borrower quoted well above the size-grid median is being priced as a worse risk. Check who is doing the pricing before you assume it is all about the borrower.
Car wash, laundromat, and vending deals sourced from social-media demand deserve extra scrutiny right now. Vending is riding the car-wash curve about four years behind.
Lender selection is a real decision. Routing a deal to a below-median book changes the credit quality of what you are placing, and the excess risk at high-volume small-balance shops survives the size adjustment.
The confirmed opportunity is 7(a)-only clients in building-ownership industries: full, fresh 504 capacity from July 4. For 504-only clients, run the per-borrower headroom math and leave the aggregate out of the pitch.
Underwrite fast-grower risk explicitly when placing paper with lenders whose book doubled in two years. That growth rate alone predicts materially worse charge-off.
For Bankers
Reserve and stress-test the FY24-25 book against the FY2006-08 charge-off range, not the tighter FY2010-13 range. Revisit formally around FY2029 when the cohort seasons.
If your book doubled in two years, ask whether growth was purchased with product mix rather than credit discipline. The backtest says fast growers charge off 1.6x worse.
Budget cancellations closer to 17-18% than the 10-13% of the last five years until FY2025's 5,491 pending commitments resolve and the shutdown overhang clears.
Do not size reserves off this single snapshot’s raw percentages; check exposure on both count and dollar bases. Flag arts & fitness and transportation for closer monitoring.
If your franchise book concentrates near the exhibit’s high end, check whether the brand’s footprint and support model changed since the FY2010-19 vintage. Treat zero-charge-off brands with the Wilson upper bound, not zero.
The market prices well inside the regulatory ceiling, and the quartile evidence says that gap is deliberate. The 2021-22 variable-rate book carries a hiking shock on top of the ordinary risk premium and deserves separate monitoring.
Treat elevated recent-vintage volume in these three NAICS codes as a portfolio flag, especially loans originated near each category’s volume peak. A monitoring signal, not a basis for blanket pullback.
Benchmark your book against sector, size, and program expectation, not a raw peer average, and check how much of any gap is vintage timing before concluding you have a skill problem or a skill edge.
The notice moves the ceiling, not the credit box. Build pipeline against the 86,984-entity 7(a)-only, building-ownership population with confidence; treat the 504-only headroom population as research until SBA confirms the calculation language.
The fast-grower echo argues for growth-rate covenants and enhanced monitoring on any book scaling faster than 2x in two years. Healthcare’s rising capital intensity with a clean distress reading is a genuine opportunity.
Section CThe Flagship
Or read the whole story, straight through
Ten sections, written to be read straight through like a weekend feature. Main figures are recomputed from the loan database, external claims are linked to their sources, and each section carries its own bear case because the strongest objection belongs next to the finding.
159 inline citations · 7 full-page exhibits · methodology appendix · print-clean
Section DThe Exhibits
The picture is the argumentFive full-page plates computed from the loan record. Each one anchors a section of the report; each caption tells you exactly what was counted and what was not.
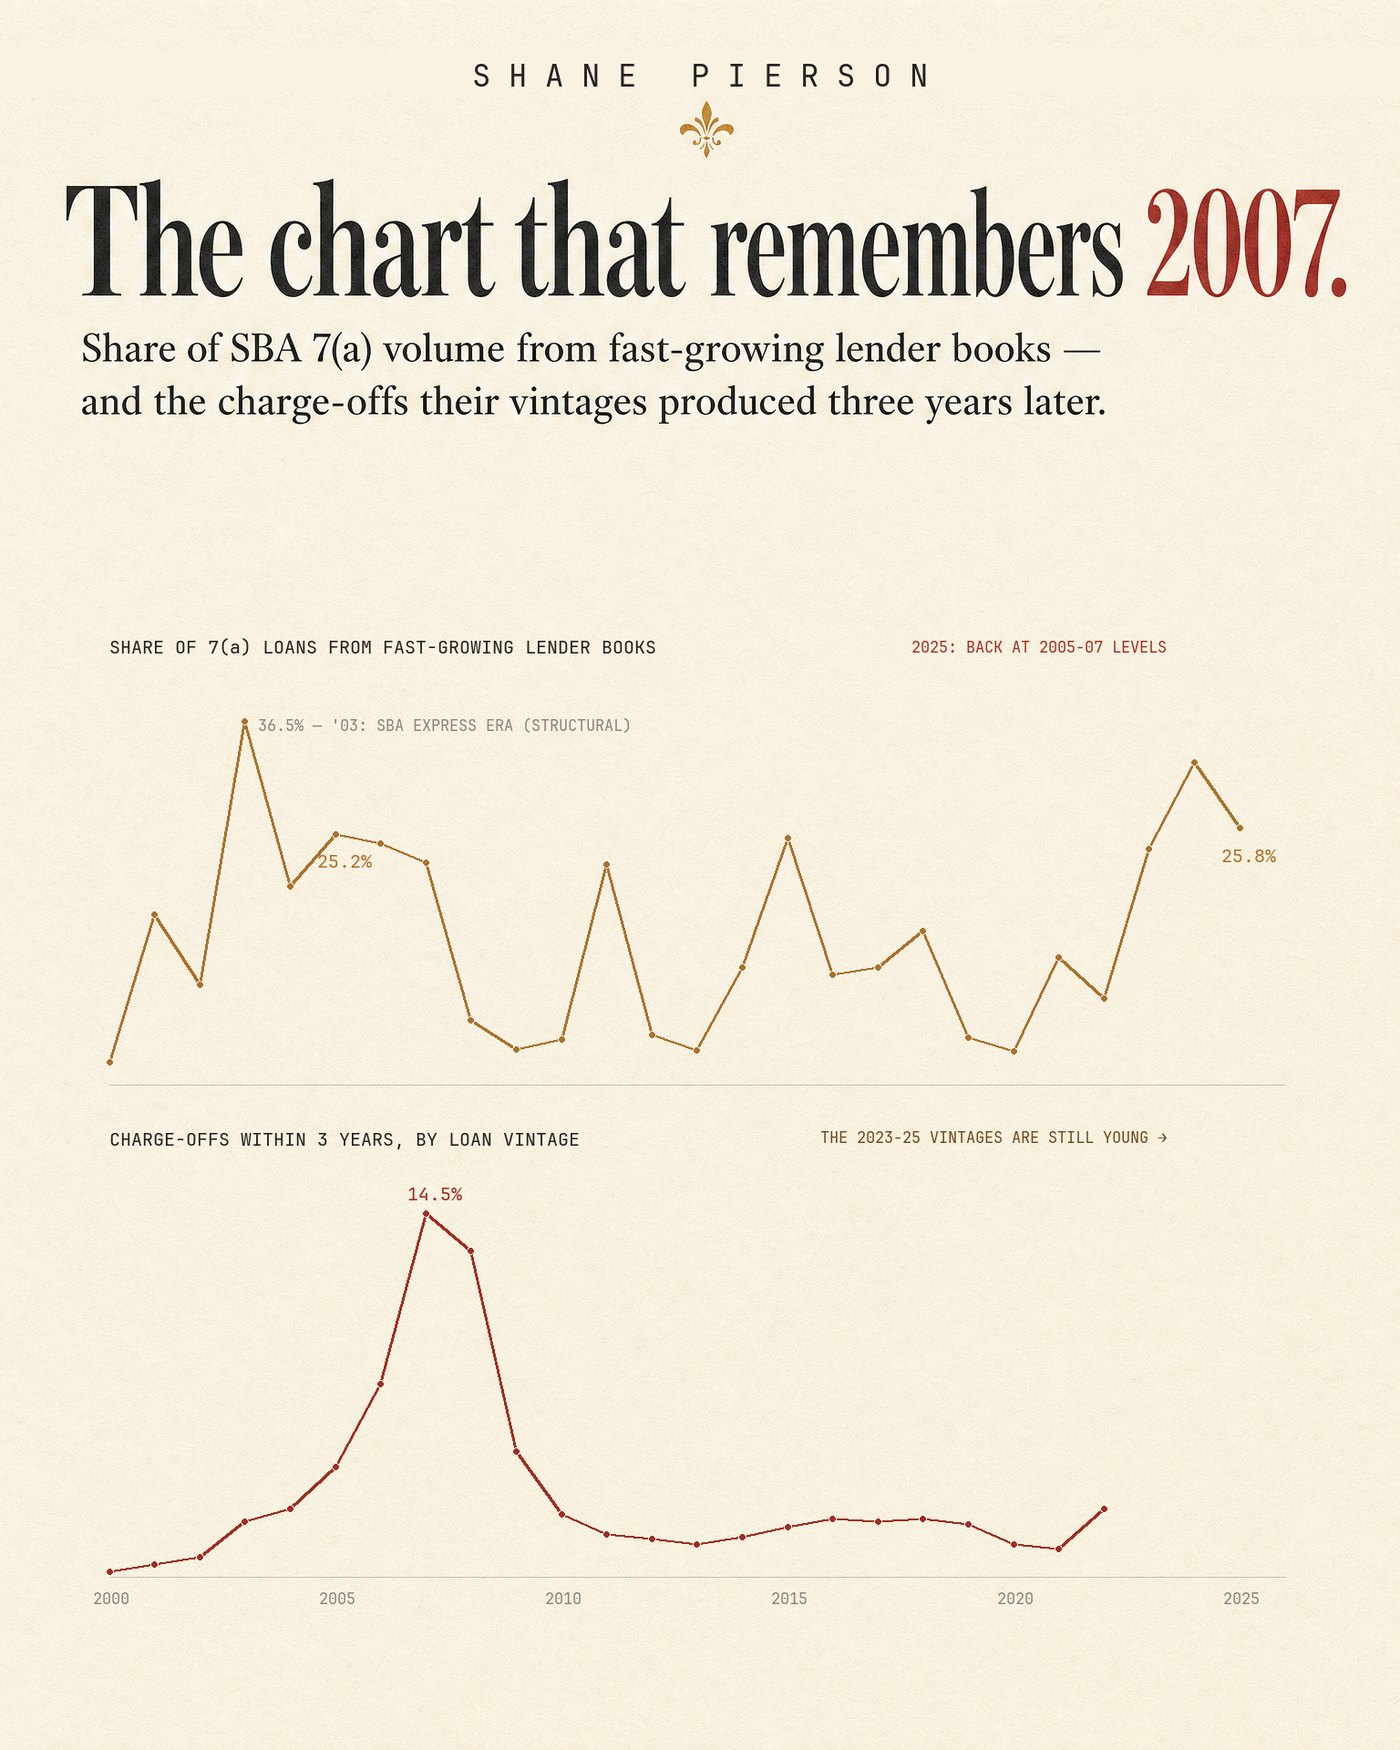
The Credit-Box Echo
The share of 7(a) loans coming from lenders whose books doubled in two years, all twenty-six years of it, next to the charge-offs each vintage produced.
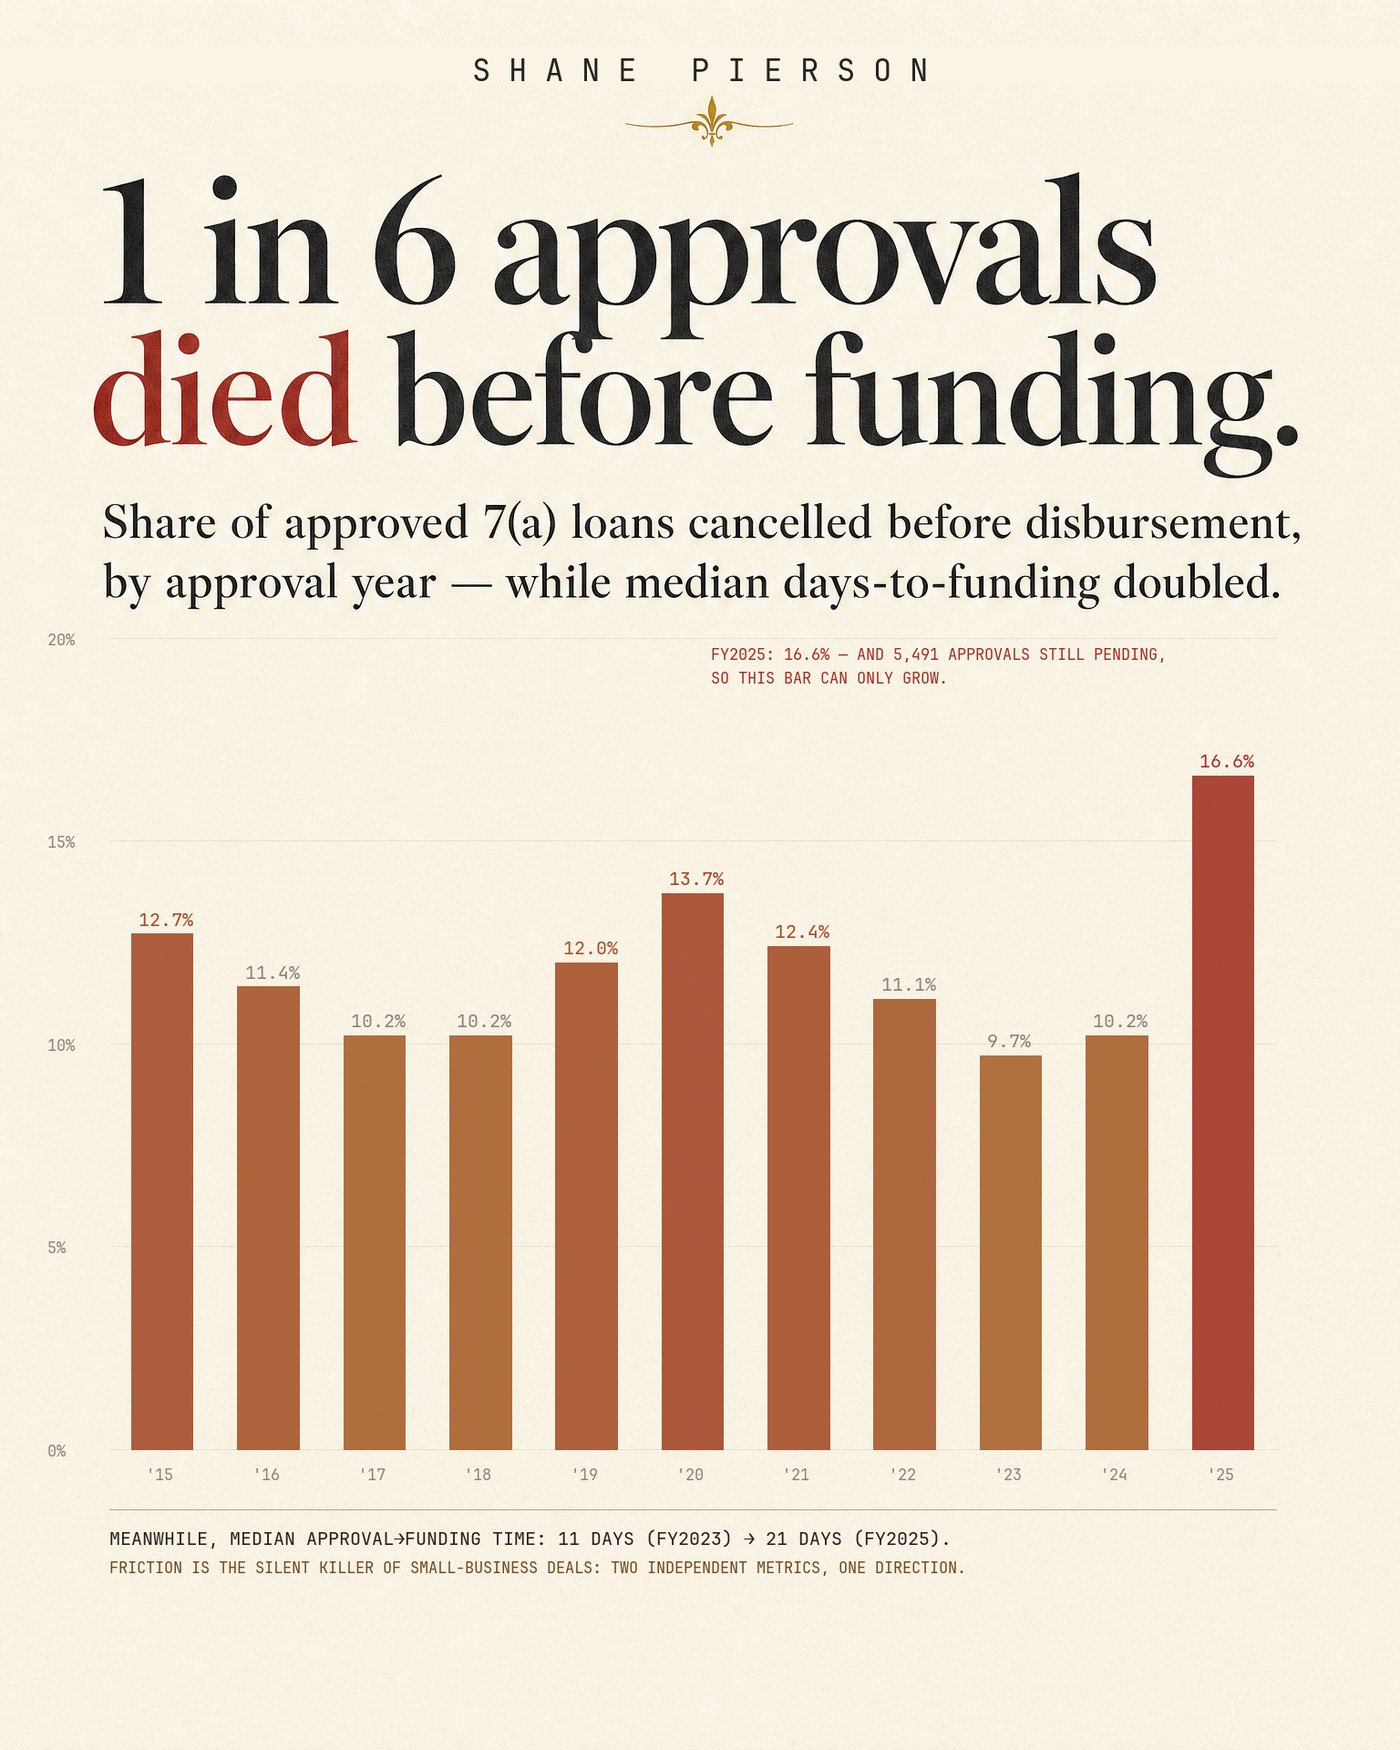
The Friction Epidemic
One in six FY2025 approvals had not funded by the March 2026 FOIA release, the highest on record, while median days-to-funding doubled.
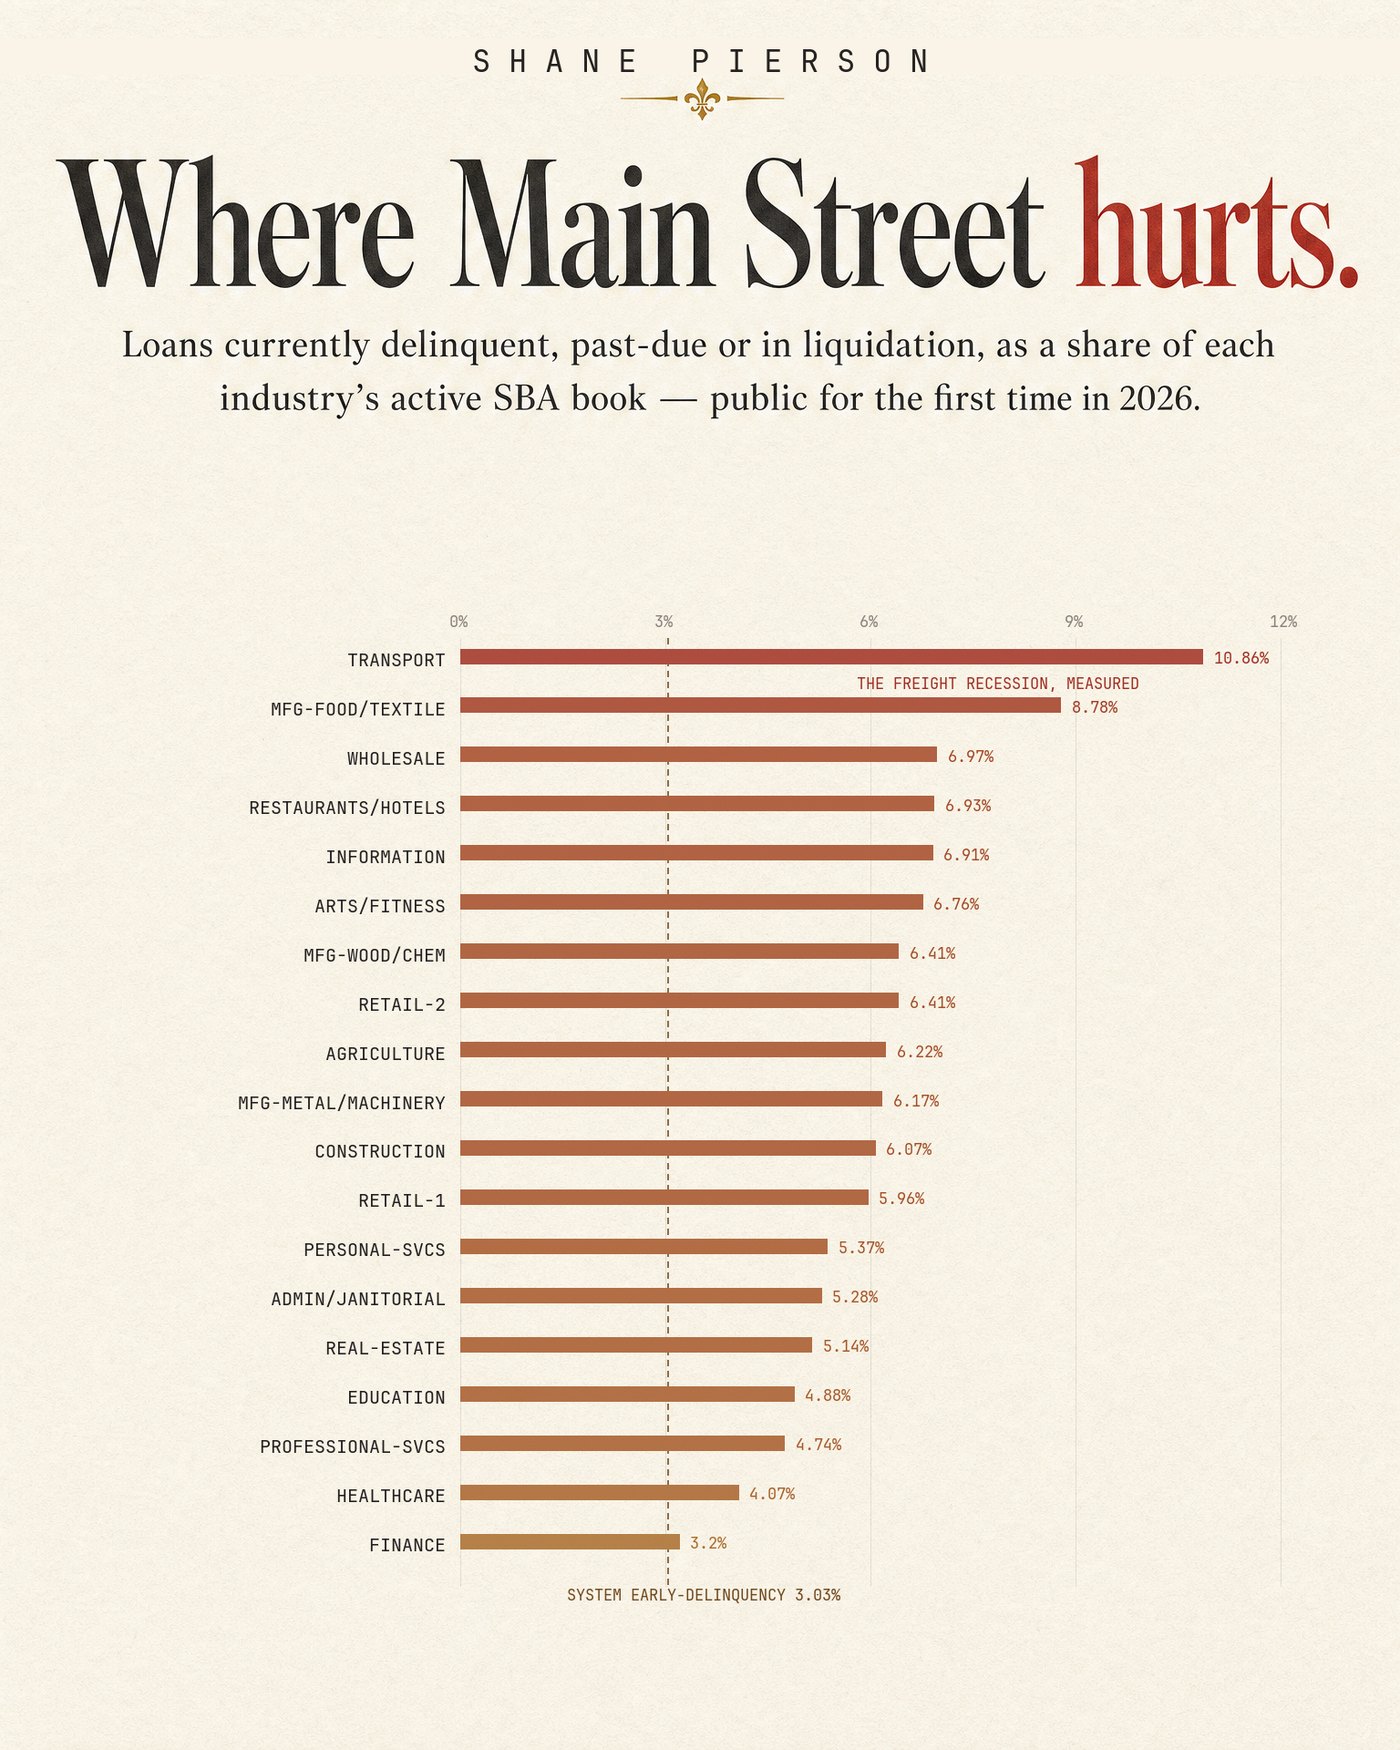
The Distress Census
The share of each sector’s active loans sitting in delinquent, past-due, or liquidation status in the March 2026 release.
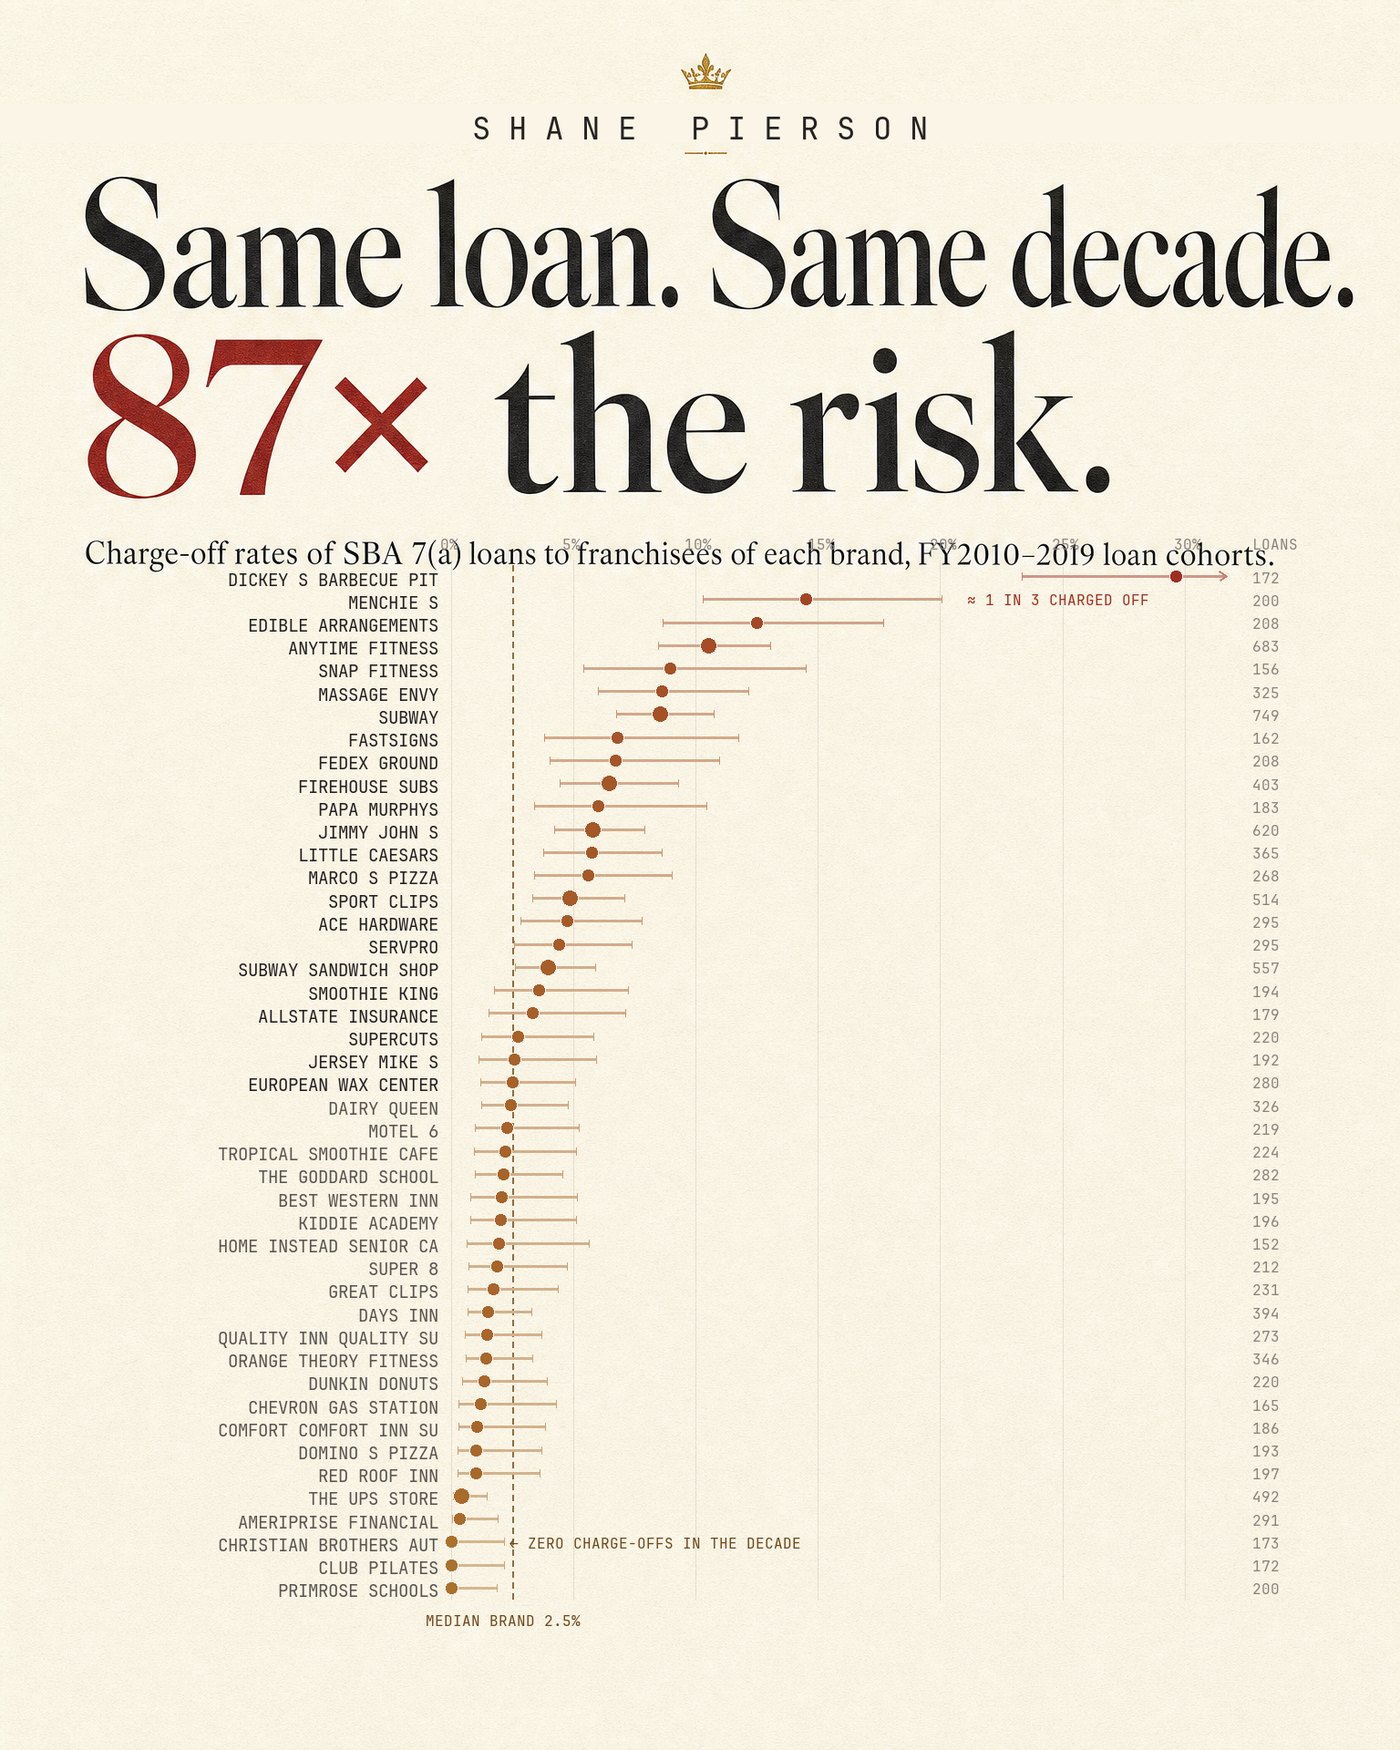
The Franchise Risk Board
45 franchise brands, 12,767 matured FY2010-19 loans, each brand’s charge-off rate with a 95% confidence interval.
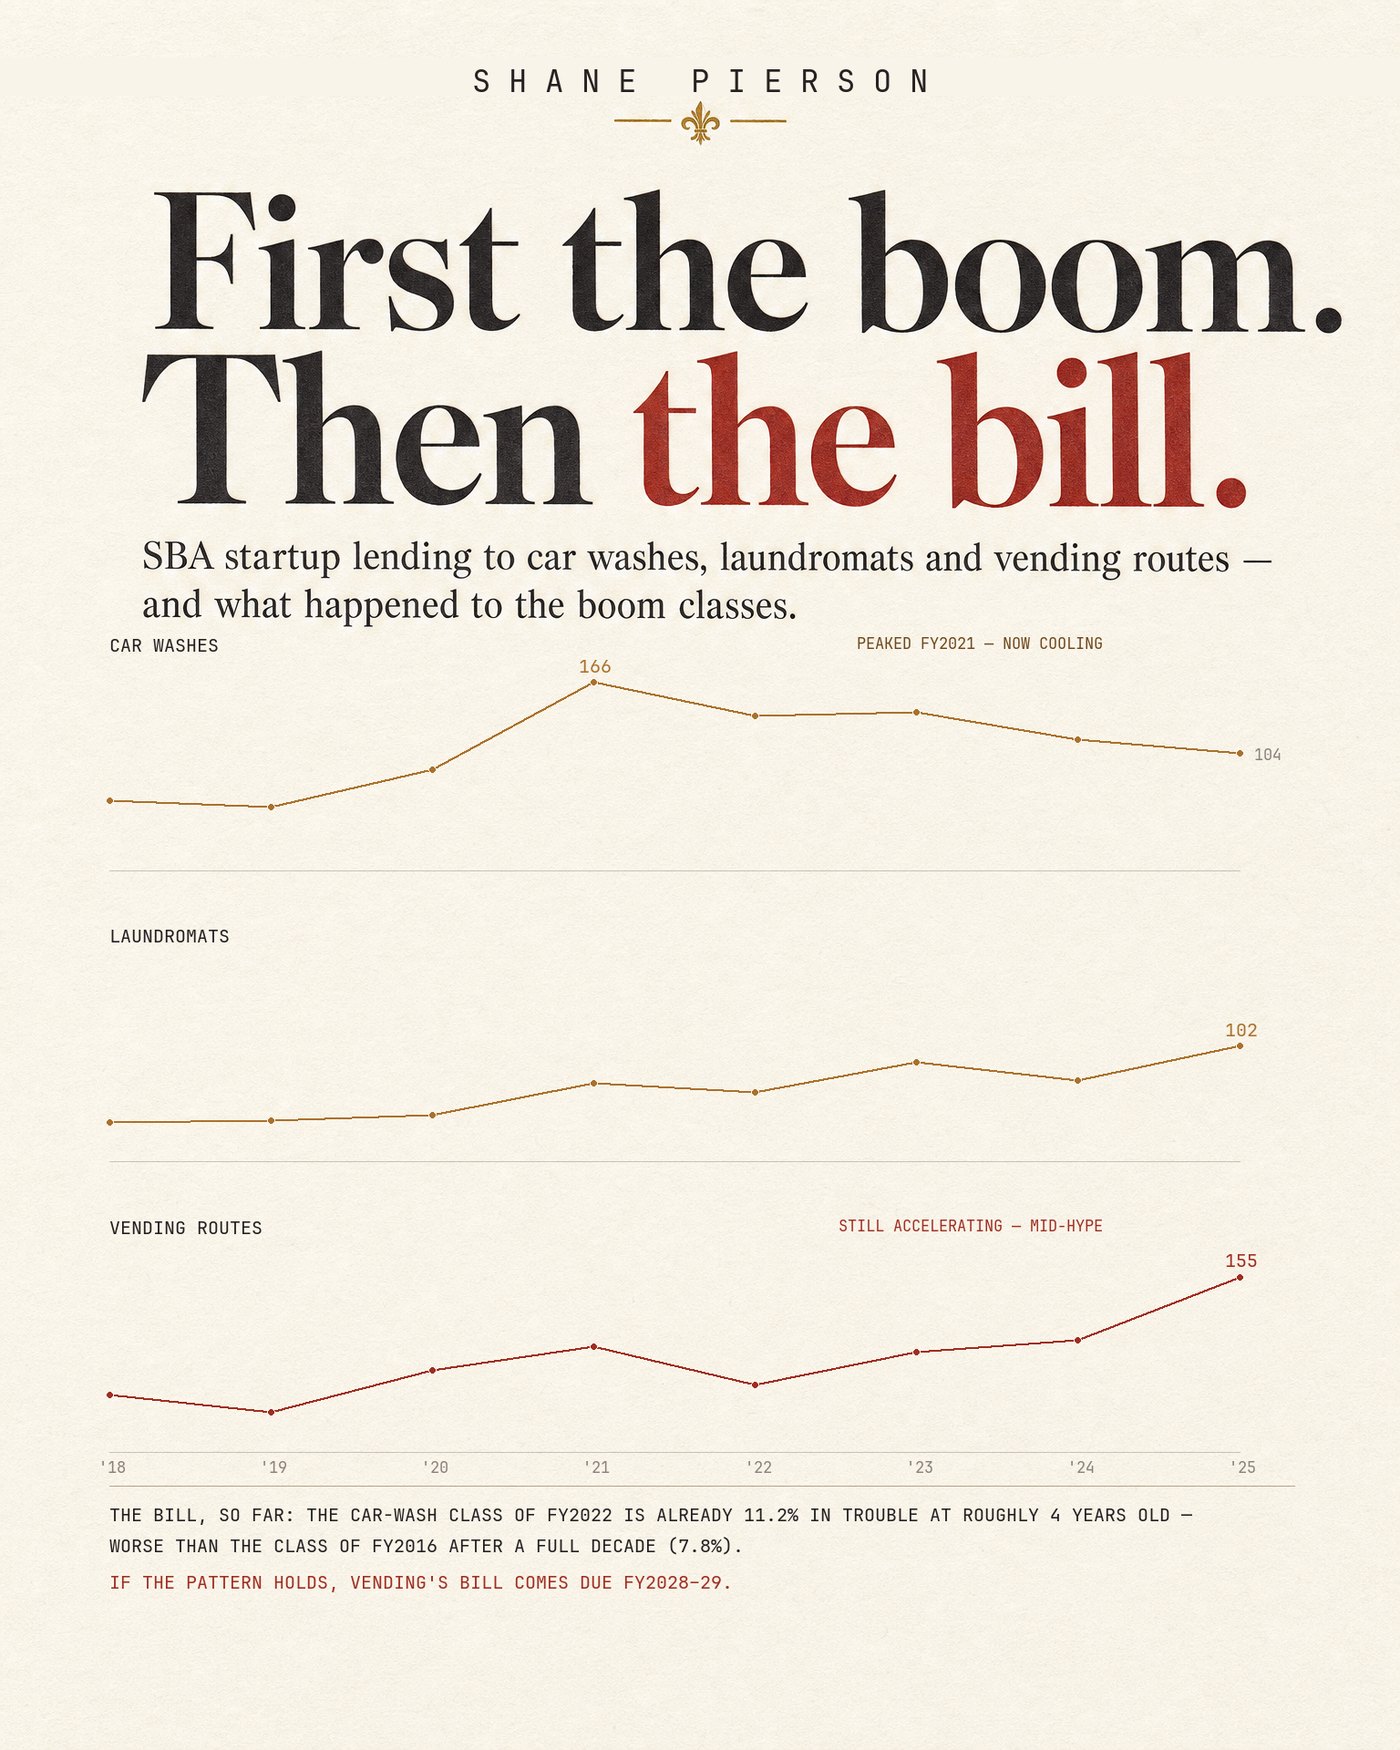
The Hype Pipeline
Startup lending to the boom trades, FY2018 to FY2025. Car wash peaked in FY2021 and has cooled since; vending is still accelerating.
Section EMethodology & Provenance
Source, date, denominator, methodThe same discipline runs under everything published here.
- Source files are downloaded from data.sba.gov with SHA-256 manifests and never edited. Transforms are code, reproducible from raw.
- FY2025 totals reconcile to SBA’s official year-end activity report to the exact loan: 78,078 loans, $37.29 billion.
- Main figures are recomputed against the database, checked against source notes, and corrected where the evidence does not hold.
- Default comparisons use matured cohorts or explicit vintage curves. Small samples are suppressed. Approval is not funding. A charge-off is an accounting event, not proof a business failed.